Evaluating stress-induced myocardial perfusion defects by non-invasive myocardial perfusion imaging (MPI) modalities has taken a leading role in the identification of flow-limiting epicardial coronary artery disease (CAD); it has excellent diagnostic and prognostic value.
Non-invasive MPI can be performed using conventional and novel gamma cameras or PET/CT.1 A range of imaging techniques has become available and more sophisticated reconstruction algorithms have improved the accuracy of each method, with the crucial benefit of dose reduction.2–4 In addition, the possibility of obtaining a variety of perfusion and functional parameters by using semi-quantitative scores has given a good insight into cardiac function.
The latest single photon emission CT (SPECT) MPI guidelines recommend reporting the extent, severity and reversibility of perfusion defect, ventricular dilatation and transient ischaemic dilation (TID).5 In particular, the TID ratio adds value to clinical and perfusion data to identify the presence of severe CAD in patients with suspected or known CAD, especially in those with diabetes.6 When ECG-gated CT is performed, it is necessary to evaluate regional wall motion and thickening and to report the ejection fraction after stress and/or at rest.
Non-invasive quantification of myocardial blood flow (MBF) and coronary flow reserve (CFR) by PET/CT increase the scope of conventional SPECT MPI from the evaluation of advanced CAD to the assessment of early stages of atherosclerosis or microvascular dysfunction and the identification of balanced ischaemia with reduction of MBF in all three major coronary arteries.7 Integrating functional data with information derived from coronary CT provides incremental information about coronary artery morphology and coronary calcium burden.8–10 New software has allowed novel parameters that may have a role in the identification of early marks of cardiac impairment to be evaluated.
We aim to give an overview on niche parameters obtainable by SPECT and PET/CT MPI that may help clinicians to detect the initial signs of cardiac damage and new therapy targets.
MPI Niche Parameters
Left Ventricular Geometry
Left ventricle (LV) geometry changes in response to exposure to cardiovascular risk factors. This is significant, given that LV remodelling is associated with poorer outcomes.11 The LV can change its structure considerably in relatively short periods of time, with the potential for pathological remodelling to be reversed to some degree.12 Previous studies have examined the relationship between cardiac volumes, ejection fraction and remodelling.13
Several non-invasive imaging techniques can be used to evaluate different structural modifications in myocardial tissue. Ultrasound and MRI studies take a two-dimensional approach to evaluate LV geometry by manual measurements obtained from perpendicular views.14–15 However, these techniques are subject to variability and depend on the experience of the operator.
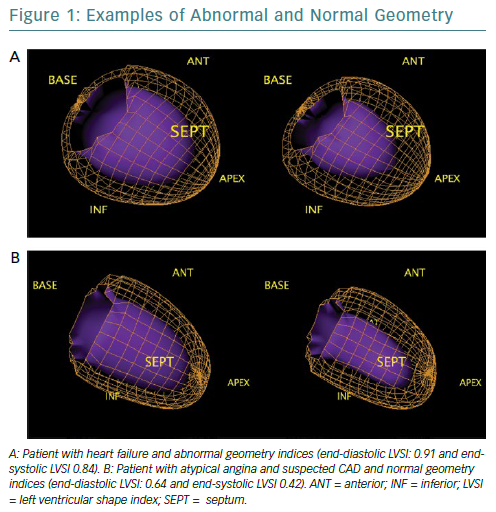
Quantitative gated SPECT allows 2D and 3D LV geometry to be evaluated, providing remodelling parameters, such as eccentricity and the end-diastolic and end-systolic LV shape index (LVSI), which are automatically generated by QGS software (QGIS Development Team).16 Specifically, eccentricity is a measure of the elongation of the LV, and varies from 0 (sphere) to 1 (line); it is calculated from the major and the minor axes of the ellipsoid that best fits the mid-myocardial surface, while LVSI is calculated as the ratio of the maximum 3D short- and long-axis LV dimension, at end-diastole and at end-systole by applying the algorithm proposed by Abidov et al.17
The closer the dimensions of the axes are, the more the ellipsoid takes the shape of a sphere (Figure 1). These parameters are highly repeatable and have been shown to have clinical utility in identifying not only patients with an exacerbation of cardiac heart failure but also early LV remodelling in patients with diabetes, demonstrating a prognostic value, even in the presence of normal myocardial perfusion.18–20 However, no studies to examine the role of these indices in the evaluation of reverse remodelling have yet been conducted.
Phase Analysis
Speckle-tracking echocardiography, cardiac MRI and nuclear imaging have allowed LV mechanical dyssynchrony to be evaluated, providing quantitative measurements of mechanical delay.21 Phase analysis by gated SPECT evaluates temporal sequence of contraction, using continuous Fourier harmonic functions, to analyse LV synchronic contraction.
Phase analysis parameters of gated SPECT at rest can be calculated using dedicated software and provides five quantitative indices (P, SD, B, S, and K) from the phase histogram to describe the phase histogram’s characteristics (time of onset, dispersion, symmetry and envelope) of the LV regional onset of mechanical contraction to quantify dyssynchrony. P is the most frequent phase (the phase corresponding to the peak of the phase histogram). SD is the standard deviation of the phase distribution. B includes 95% of the elements in the phase distribution. S indicates the symmetry of the histogram (positive S indicates the histogram skewed to the right with a longer tail to the right of the peak phase). K (kurtosis) indicates the degree to which the histogram has peaked; a histogram with a higher peak within a narrower band has higher kurtosis.22 Recently, cut-off values for SD, bandwidth (BW), skewness (S) and kurtosis (K) obtained from gated SPECT that show a good discriminatory capacity between healthy patients and those with varying degrees of cardiac mechanical dyssynchrony were suggested.23 Evaluation of mechanical dyssynchrony predicts response to resynchronisation therapy with long-term prognostic value.24–25
A method that automatically integrates the myocardial viability polar map and the polar map of LV regional contraction synchronicity from gated SPECT could be used to detect the latest contracting viable left ventricular segments and help guide resynchronization therapy.26 In a small population of patients with acute MI and multivessel disease who had undergone successful revascularisation of the culprit arteries, stress phase SD and stress histogram BW were independent predictors of events, which suggests an intriguing application of phase analysis.27
In the light of high prognostic value of such parameters, standardised cut-off values could potentially help cardiologists to interpret imaging to provide more tailored therapeutic strategies.
Relative Flow Reserve
Alongside widely validated quantitative parameters derived from PET, such as MBF and CFR, the concept of relative flow reserve (RFR) has been proposed; this is defined as the ratio of hyperaemic MBF in a stenotic area to hyperaemic MBF in a normally perfused area.28 The increasing interest on this new variable originates from the need to find an accurate, noninvasive indicator of flow-limiting coronary stenosis.
The literature has reported discrepancies regarding the relationship between conventional PET-derived measurements and invasive index significant epicardial stenosis. For example, fractional flow reserve (FFR) has a well-established inverse relationship with outcomes; lesions with lower FFR values receive greater absolute benefits from revascularisation.29,30
Even if hyperaemic MBF had a better correlation with FFR than CFR, the parameters look at different pathophysiological processes: hyperaemic MBF not only measures the entire single coronary vascular bed affected by an epicardial stenosis but also indicates microvascular resistance. Therefore, a reduced hyperaemic MBF may be an epiphenomenon of two different kind of coronary vascular damage and it cannot separate the effects of a specific lesion from those of microvascular dysfunction. RFR shows a linear correspondence with FFR and it has been reported that RFR of 0.70–0.80 predicts FFR ≤0.8 with good diagnostic performance.31 A recent study used PET-derived CFR and RFR as references to compare the diagnostic performance between FFR and resting indices in predicting ischaemia.32 However, prognostic data are needed to validate this new variable.
Vascular Age
From hybrid techniques for MPI, such as PET/CT, some parameters have emerged as additional, earlier marks of cardiovascular impairment. Vascular age, for example, is a novel variable based on the logarithmic transformation of the coronary artery calcium (CAC) score measured in Agatston units into a theoretical age in years that better identifies degeneration in the vascular system than chronological age due to calcium deposit.33 Calculating the CAC score already has a primary role in atherosclerosis evaluation. Clinical practice guidelines in the US and Europe consider CAC scoring could improve cardiovascular risk assessment in asymptomatic people and guide preventive therapies.34,35 Of note, it has been widely demonstrated that patients with suspected CAD without evidence of coronary calcium do not need further cardiac imaging investigations.36–39
This emerging concept of assigning a vascular age to patients undergoing coronary CT is based on evidence that plaques in elderly patients are more calcified than those in younger patients. The findings of large-scale studies, including the Multi-Ethnic Study of Atherosclerosis (MESA) and the St Francis Heart Study, demonstrate that vascular age is better for risk assessment because it is a much stronger predictor of cardiovascular events than chronological age.40,41
Recently, we demonstrated that coronary vascular age, assessed using CAC score, is associated with stress-induced myocardial ischaemia in patients with suspected CAD and this marker appears to be more accurate than chronological age in predicting ischaemia.42 Therefore, vascular age has a better clinical utility when making decisions on therapies and healthier lifestyles.
Epicardial Adipose Tissue
Epicardial adipose tissue (EAT) is the heart’s fat storehouse. It is located between the myocardium and pericardium, sharing the same perfusion of the heart with no barrier.43 It produces different bioactive substances that can affect cardiac function.44
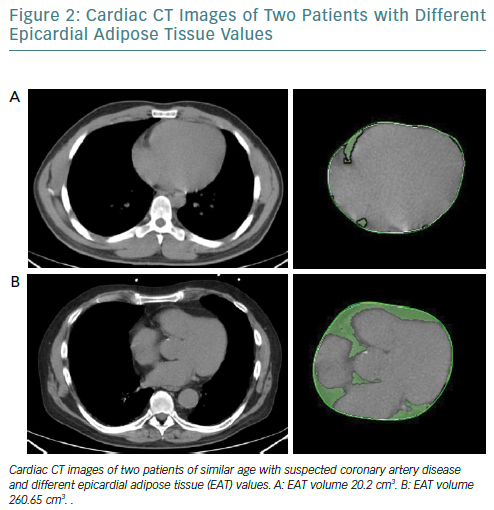
It is increasingly thought that the traditional anthropometric indices of pathological obesity such as BMI and body surface area may not identify obese patients who have an increased risk of cardiovascular events.45,46 EAT can be measured using different modalities and indicators. While echocardiography allows the evaluation of EAT thickness with good reproducibility, it does not provide an estimation of the total epicardial fat amount; however, cardiac CT (Figure 2) and MRI give detailed volumetric quantification of fat load with high reproducibility.47
It has been recently observed that increased EAT volume is associated with coronary calcium burden, inflammatory markers and poorer outcomes; it also associated with cardiac sympathetic denervation, which can lead to catecholamine production in a cardiac response to sympathetic stimuli.48,49
Therefore, EAT evaluation could play a part in the atherosclerosis development and may be considered a marker and a therapeutic target at the same time.
Behind and Beyond Myocardial Perfusion Imaging: Myocardial Innervation
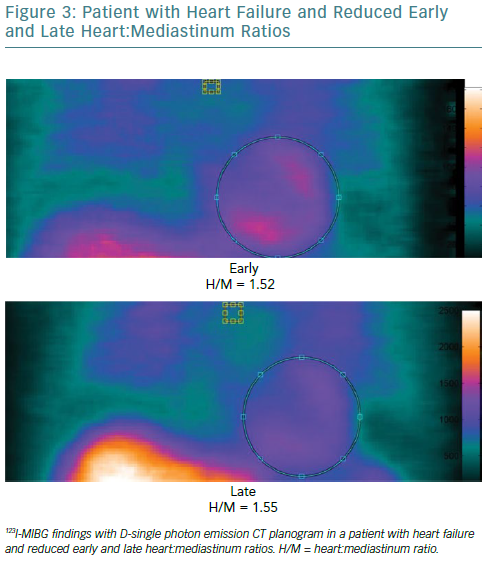
Both myocardial perfusion and innervation can be studied by conventional and novel gamma cameras. Cardiac neuronal function is compromised in a number of cardiac diseases. Therefore, the evaluation of functional and electrophysiological properties of the autonomic nervous system at cardiac level has become a focus of interest in the field of cardiovascular imaging.50 A number of radiopharmaceuticals are used to investigate autonomic neuronal functions.51 It has been widely demonstrated that the status of catecholamine storage at the level of the myocardial sympathetic presynaptic fibres can be assessed with 123I-labelled meta-iodobenzylguanidine (123I-MIBG).52–54 In addition to the traditional evaluation of heart:mediastinum (H:M) ratios obtained by early and late planar acquisitions, the innervation defect size can be measured by performing supplementary tomographic imaging.
From SPECT images, tracer uptake can be assessed semi-quantitatively using the 17-segment model and a 5-point scale: 0 = normal uptake; 1 = mildly reduced uptake; 2 = moderately reduced uptake; 3 = severely reduced uptake; and 4 = no uptake. The total defect score (TDS) can be calculated on the polar maps by the sum of the 17 segmental tracer uptake scores. Therefore, the innervation defect size can be expressed as percentage of the total enervated myocardium (% LV) using the formula: TDS/68 × 100, where 68 is the maximum TDS in the 17-segment model. Defect severity, as defined by TSD on 123I-MIBG SPECT using a conventional Anger camera, is significantly associated with inducible ventricular tachyarrhythmia in patients with left ventricular dysfunction and previous MI.56
Imbriaco et al. recently showed that sympathetic neuronal damage evaluated by TDS obtained from 123I-MIBG imaging might detect cardiac involvement at an early stage in patients with Anderson-Fabry disease, leading to straight therapeutic strategies in patients prone to LV fibrosis development.57
The addition of SPECT method on 123I-MIBG imaging overcomes the limitations in the interpretation of planar acquisition, such as the superposition of noncardiac structures and lack of segmental analysis, and improves the clinical utility of this technique for diagnosis and prognosis. However, visual scoring of 123I-MIBG SPECT images is challenging and they need to be compared to normal data files. Moreover, SPECT requires longer acquisition time so can be performed only in fully collaborative patients.
Future directions
The recent introduction of solid-state cardiac cameras with cadmium-zinc-telluride (CZT) detectors, which have higher photon sensitivity and spatial resolution than standard cameras, may allow parameters obtained by 123I-MIBG SPECT imaging to be used to gain a more accurate evaluation of cardiac adrenergic activity (Figure 3). Moreover, the possibility of obtaining both planar equivalent images and SPECT data during the same acquisition, thanks to the advanced geometry of these cameras, makes the examination shorter and more comfortable.
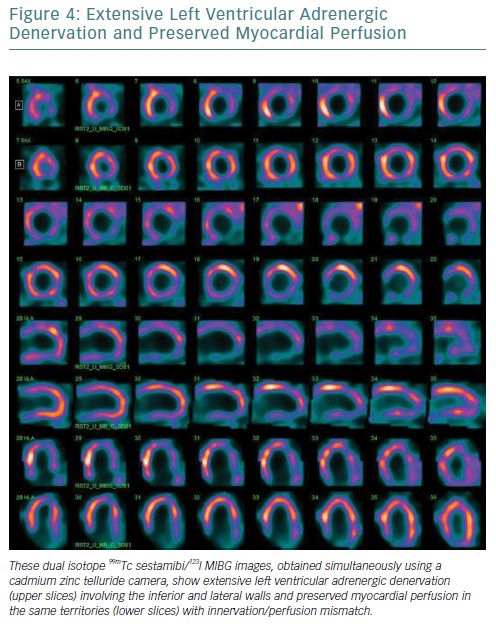
Furthermore, the narrower energy windows and better photon energy discrimination of CZT technology allow simultaneous 99mTc-sestamibi/123I-MIBG dual isotope imaging with a significant reduction in down-scatter of the two isotopes’ photopeaks.58–61 From this perspective, the possibility of viewing myocardial perfusion and innervation in one imaging session (Figure 4), combined with the opportunity to obtain more accurate parameters for innervation evaluation such as TSD, offers significant potential.
The extensive pool of available data has prepared the ground for the challenge of the future that is the use of machine learning and artificial intelligence for clinical applications. Machine learning is the area of computer science that exploit available information to produce reliable and repeatable choices to guide clinical decision-making. This approach seems very promising in the era of personalised medicine.62–64
The integration of information derived from traditional and novel parameters with data obtained from demographics may have a role in driving diagnostic work-up in individual patients, making medical care more personalised. However, this requires a great deal of measurement and evaluation, from image acquisition, through imaging parameters generation and developing decision-making algorithms before a critical clinical choice therapy based on human critical thinking rather than choice generated by machine algorithm can be made.


